Dashboard Chart – Responsive Admin Dashboard Template (HTML, CSS, JavaScript)
Dashboard Chart is a responsive admin dashboard built using HTML, CSS, and JavaScript. Ideal for displaying data insights, analytics, and reports in real-time.
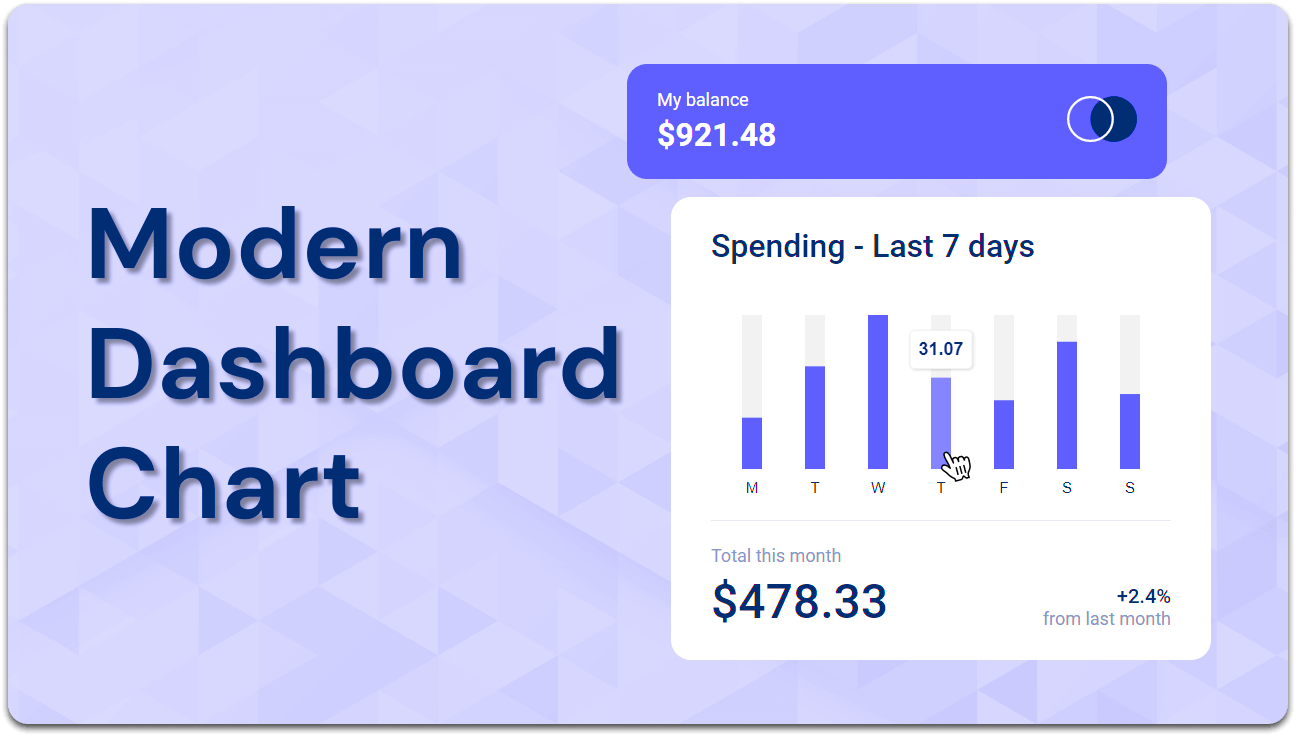
Dashboard Chart is a modern and responsive admin dashboard template designed to present real-time data insights, analytics, and reports in a clear and interactive way. Built with HTML, CSS, and JavaScript, it provides a lightweight, customizable foundation for business intelligence platforms, SaaS dashboards, admin panels, and data-driven applications.
The template includes chart visualizations that can be powered by libraries like Chart.js or ApexCharts (easily pluggable), offering bar charts, line graphs, pie charts, and more to represent your key metrics. Its responsive design ensures that dashboards remain functional and readable across all devices — from desktops to tablets and mobile screens.
Whether you're building a finance dashboard, user analytics platform, or project management system, Dashboard Chart offers clean design and a solid front-end structure to get started quickly.
Key Features:
-
Fully responsive dashboard layout
-
Built with pure HTML, CSS, and JavaScript
-
Ready for chart integrations (e.g., Chart.js, ApexCharts)
-
Ideal for admin panels, analytics dashboards, BI tools
-
Customizable and easy to expand
-
Lightweight, fast, and SEO-friendly
Use Dashboard Chart to visualize your data professionally and make informed decisions with clarity and precision.