Dashboard templates Responsive for Bootstrap
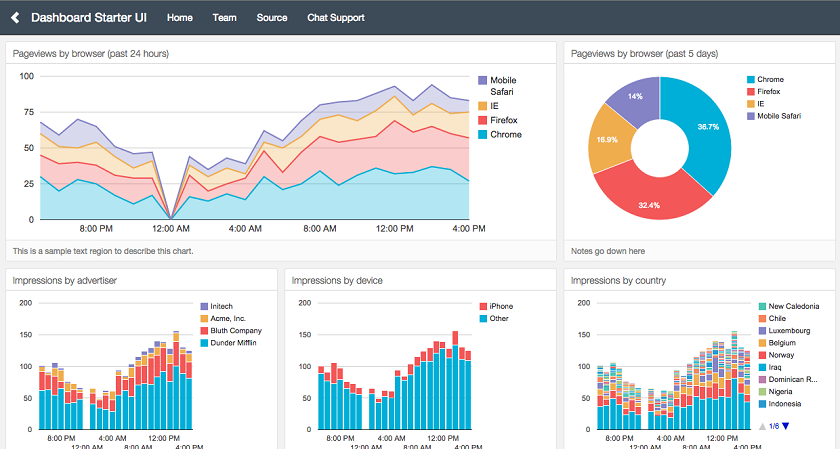
Dashboards is a free a responsive dashboard template for bootstrap. It has an attractive, custom analytics dashboard that's ready to be shown to your team or your customers. No hours lost tweaking CSS or testing responsiveness on eight different mobile devices.
The Templates
These layout templates are composed of a minimal set of Bootstrap v3.2 custom styles. They cover the most common use cases and layout configurations we've encountered so far.
- Layouts for pre-built, responsive dashboard views
- Examples for specific domains, data models and popular integration
Integrations
These templates can work with any data source or charting library, but they're particularly streamlined to work with Keen IO's Dataviz SDK. To see the Keen integration in action, create a free project and send some data to it. Then add some charts to your dashboard with just a few lines of code.
Usage
Ready to use one of these awesome layouts? Here's how to get started.
-
Download a copy of this repository as a zip file. You can also type
git clone keen/dashboardsin your terminal. -
Check out the various layouts and pick the one that best suits your needs. Find the template in the repository you downloaded at
folder/layouts/(name-of-template). -
Start editing! In the destination folder will exist an
.htmlfile. Open it in your favorite text editor. There are three things you need to do to edit your dashboard: -
Setup: If you're a registered Keen IO user, navigate to your keen project or if you don't have a user at first, you can simply use some demo data that we've prepared for you. You can access those by going to the repository and navigating to demo-data. There, you will see some javascript files with some code in them. We will simply paste those in the .html file.
-
Some copypasta. When you navigate to the bottom of the .html file, you can see that there are a bunch of script tags. Just before the end of the body tag, we're going to add in the code from sample.html. Simply copy and paste the code just before you see
</body>. -
Once you've done that we need to hook up the specific items within the template to the code that we've just pasted in to our file. In line 21 of sample.html, you will see a line of code:
document.getElementById('chart-01'). That means that this query will try to find inside the html file a node with an id of 'chart-01'. In these templates, you will see lines of that resemble something like:
<div class="chart-stage"> <!-- This is where you need to put the id property in! -->
  <img data-src="holder.js/100%x650/white">
</div>
Now we're going to change those lines so that it looks like this:
<div class="chart-stage" id="chart-01"> <!-- This is where you need to put the id property in! -->
  <!-- Get rid of that img tag! -->
</div>
You're finished! Congratulations on setting up your first chart! Repeat step three with the rest of the items in the template to complete your dashboard!